Use Reports Reporting Suite tools to generate and customize reports.
Requirement – Assign Reports Permissions
Practices must assign permissions to reports for each practice role must be assigned permissions to reports in Administration: Reports Role Permissions. Practice administrators can assign these roles to users in Administration: User Maintenance in the Reporting Roles section.
Report Data
Data for the majority of Practice Management reports is updated within one hour behind real-time data. This means that report data may be up to an hour old. We provide when data is updated in the report (shows after you select the report name). For more information about each report's data, refer to Reports Reporting Suite Data.
Note: While a one hour delay behind real time is not guaranteed, our goal is 30 minutes to one hour behind real-time data. Check Success Community for any known issues with report data delays.
Report Formats
Report Sources
| Report Categories | Description |
|---|
| Charge-based Reports | Reflect the data available in the on-screen ledgers. These are point-in-time reports, resulting in different values for the same time period when generated at different points in time. Use these reports to review service line information (for example, procedure code, date of service, charge amount, adjustments, etc.).
- Report Types: Charge and Production
|
| Payment-based Reports | Reflect the payment-level details viewable in Payments pages. Payment reports are best suited for balancing to the bank account as they include all payments posted (for example, applied, unapplied, insurance, patient, capitation, etc.). Charge-based and transaction-based reports only reflect applied payments. These are point-in-time reports, resulting in different values for the same time period when generated at different points in time. Note: If the payments from the prior time period are not edited the amounts will not change.
|
| Transaction-based Reports | Reflect all AR balance-changing events (for example, charge activity, apply/unapply payments, write-offs, etc.). For balancing purposes, it is important to understand transaction reports only report the activity of applying and unapplying payments from a claim. The amounts do not change when comparing reports for the same time period at two different points in time when reporting by the transaction's created date or ledger date if the month has been closed.
|
| Combination Reports | There are various types of combination reports available (for example, Monthly Financial Summary, Practice Month End Performance, and Goals). Reports are combined from different categories to help consolidate important data. Depending on the report, reporting data is as of the previous day or is monthly. |
| How do I know which report category the report is? | After selecting the Report Name in the reporting tool, the data source/report purpose shows if the report is a charge, payment, transaction, or combination report. If the source/purpose information does not include mention of any of these reports, it is a combination report. |
Open Reports
From the Reports menu, select Reports. The reporting tool opens in a new tab. Depending on your browser configuration, you may have to accept pop-up windows.
Select a Report
- On the NextGen Office Reports page, select a Report Type.
- Select a Report Name. The filters that appear below depend on which report is selected.
- Report description: Shows next to the Report Type after you select a Report Name.
- Data source/Report purpose: Shows next to the Report Name.
- Note: Reports from different sources will not necessarily align. For example, the charge amount in charge ledger reports by created date will not always match the charge amount in ledger transaction reports.
- Select from the filter options.
- Click Generate Report.
Time Zone in Reports Generated by Created Date
In reports run by created date, the created date reflects the user’s computer’s time zone. In cases where a different time zone leads to a different day (for example, biller and practice are in different time zones), you must change the user’s computer’s time zone to generate the correct date.
Save Bookmark
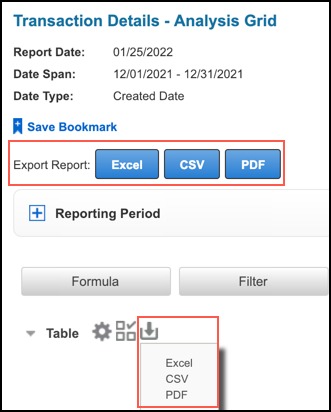
To save the report as a bookmark, click Save Bookmark.
Export Options and Notes
- There are two areas where you can export data to Excel, CSV, or PDF.
- Formatted reports do not have the CSV option.
- Only analysis grids have the Table export options.
- Export Report: You must use these options at the top of the page if charts or other graphics are needed during export. You can export everything that is on the page. Since this export option involves additional logic, it is more likely to have data loss if a large number of rows are exported.
- Excel export limit: Roughly 200,000 rows
- CSV export limit: 500,000 rows
- Exporting large datasets can lead to time-out issues and thus data loss during export. Issues are more likely to occur from enterprise reports when they exceed 200,000 rows.
- Table export options: You can only export the data table. No graphics are exported. This export is more reliable with large datasets, but data loss could still occur.
- To validate that the expected number of rows are exported, we recommend using Aggregate to validate the values that should be exported. Sum financial columns or count rows.
- Note: Aggregates or any table customization do not export to CSV.
All accounts receivable (AR) summary reports (Report Type = Accounts Receivable) are formatted reports. Formatted reports are printable and not designed to be manipulated in Excel.
Reporting Period
- You can select a different Reporting Period and regenerate data.
- Click
 to expand the Reporting Period section of the page.
 - Select the new Time Period or Start Date and End Date.
- Click Generate Report.
- The reporting period is not required on the Reports home page for AR summary reports; therefore, if you do not select a reporting period on the home page, this option is not available on the selected report's page.
- Date Type remains the same as what was previously selected.
Data Tables
Data tables are read-only, on-screen spreadsheets that can only be exported.
- Contain a limited number of columns so that they are printable.
- Have predetermined grouping and totaling (for example, charge amount).
For greater control over the data generated into a report, select the analysis grid equivalent of the report. For example, use the Transaction Details – Analysis Grid instead of the various transaction summary data tables.
Reporting Period
- You can select a different Reporting Period and regenerate data.
- Click
 to expand the Reporting Period section of the page.
 - Select the new Time Period or Start Date and End Date.
- Click Generate Report.
- Date Type remains the same as what was previously selected.
Analysis Grids
The advantage of an analysis grid over a data table is the ability to manipulate the data to customize the reports.
- Analysis grids have more column options.
- Columns are movable.
- Includes tools to customize the data
Save Bookmark, Table Tools, and Export Options
For more information on exporting data, see Export Options and Notes.
- Save Bookmark: Click to save the report as a bookmark.
- Export Report: Click Excel, CSV, or PDF to export everything that is on the page (for example, table and chart). Use this option if you want to include graphics.
 : Shows or hides the basic table configuration options.
 : Adds a dashboard panel derived from table content.
 : Exports only the data table to an Excel, CSV, or PDF file. No graphics are exported.
Reporting Period
- You can select a different Reporting Period and regenerate data.
- Click
 to expand the Reporting Period section of the page.
 - Select the new Time Period or Start Date and End Date.
- Click Generate Report.
- Date Type remains the same as what was previously selected.
Table Configuration Tools
There are two sets of table configuration tools, enabling you to customize reports.
Basic Configuration Tools
Click  to show the tools.
| Option | Description |
|---|
| Column | Shows or hides columns. |
| Sort | Sorts the table. |
| Group | Organizes the rows by grouping columns |
| Aggregate | Calculates multiple data rows based on specific criteria to form a single value |
| Paging | Sets the number of rows that show per page |
Advanced Configuration Tools
| Option | Description |
|---|
| Formula | Adds columns using formulas |
| Filter | Filters the rows by the cell values |
| Add Chart | Creates a chart based on the report's data |
| Add Crosstab | Create a pivot table by pivoting columns of data into rows of data |
Columns
When you click  , Columns is selected by default.
- Select the check boxes for the table columns you want to show.
- Click OK.
Note: We have set default columns for each analysis grid. The default columns depend on which analysis grid you generate.
Sort
- Click Sort.
- Select the Data Column.
- Select the Order Direction.
- Click Add.
- To replace an existing sort with a new sort, click Replace instead of Add.
- To remove a sort, click Remove.
Group
- Click Group.
- Select the Grouping Column. In this example (Date of Service), select year, quarter, month, or day; else, it will group by day.
- Click Add.
- To replace an existing group with a new group, click Replace instead of Add.
- To remove a group, click Remove.
Aggregate
- Click Aggregate.
- Select the Data Column to calculate for.
- Select the Aggregate Function (calculation to perform). Depending on which data column is selected, the aggregate function options change.
- Select the Results Positioning (where the result shows). If you have more than one aggregate, the last position you selected applies.
- Click Add.
- To replace an existing aggregate with a new aggregate, click Replace instead of Add.
- To remove an aggregate, click Remove.
Paging
- Click Paging.
- Enter the number of Rows per Page to show.
- Click OK.
Column Heading Configuration and Formatting Options
There are a limited number of configuration options accessible from the column heading. Formatting options are only available here.
Note: For illustrative purposes, both the Aggregate and Format select menus are shown. They are normally shown individually upon selection.
- Click the column heading.
- Select an option from the pop-up menu.
- Click Formula.
- Enter the column Name.
- From the Insert a column menu, select the individual column names that you want to enter into the formula and then click Insert.
- Enter mathematical symbols to complete the formula.
- Select the Data Type.
- Select the Data Format.
- Click Add.
The new column appears in the right-most column position.
- To replace an existing formula with a new formula, click Replace instead of Add.
- To remove a formula, click Remove.
Note: If you replace or remove a formula, the column is deleted from the report.
The new column also displays under Columns.
Filter
- Click Filter.
- Select the Filter Column.
- Select the Comparison.
- Select the Value.
- Click Add.
 : Shows applied filters.
- To switch the Add or Or to the filter equation, click the Add/Or toggle button.
- To replace an existing filter with a new filter, enter the new filter values and then click Replace instead of Add.
- To remove a filter, click Remove.
- If you have more than one filter, additional options appear.
- To reorder the filters, click the up and down arrows.
- To remove parentheses from, or add parentheses to, the filter equation, click the minus or plus icons.
- To remove all of the filters, click Remove All.
Add Chart
You can create (or edit) a chart based on the reporting data in the table.
- Click Add Chart.
- Click the desired chart type.
- Select the Label Column.
- Select the Data Column and select whether to show percentage or value.
- Select the Data Aggregation.
- Select the Relevance.
- Click OK.
 : Shows or hides the chart menu panel.
 : Adds a dashboard panel derived from the chart content.
 : Removes the chart.
Add Crosstab
Like in a chart, you can create (or edit) a crosstab based on the reporting data that appears in the table.
- Click Add Crosstab.
- Select the Header Values Column.
- Select the Label Values Column.
- Select the Aggregate Values Column.
- Select the Aggregate Function.
- Select the Summary Function.
- Click OK.
 : Shows or hides the crosstab menu panel.
 : Adds a dashboard panel derived from the crosstab content.
 : Exports the crosstab into an Excel or CSV file.
 : Removes the crosstab.
Bookmarks
- Bookmarks are shared across the practice. You only see bookmarks for reports that you have permissions to.
- Bookmarks are currently unavailable for enterprise users.
- Date span selection is important for bookmarks to be used properly. You must select the dates using the drop-down options (for example, last month) on the Reports home page.
- To open the bookmarks, click View Bookmarks.
- To save your report as a bookmark, click Save Bookmark.
See Also: Glossary of Reporting TermsReport Types and Report Names - Part 1Report Types and Report Names - Part 2Report Types and Report Names - Part 3Reports Article IndexReports Reporting Suite DataReports Role Permissions
Last Review Date: 10/17/25