The Goals report enables you to set goals for data points that are pulled from the Provider Month End Report. These data points are displayed as an arc gauge chart to monitor the progress of the goal. Bar graphs track the progress of the goal on a monthly basis.
| Report Type | Description | Source/Purpose | Reporting Data |
|---|
| Practice Performance | Compare monthly transactions (e.g., charge, adjustment, payment, appointments) to created goals or prior month averages. The currency transactions are reported by ledger date in the closed month. | Ledger transaction reports track AR balance-changing events. This report presents a monthly snapshot of the data. After the month closes, the data does not change. This report is updated after the end of each business day. Important transactions are presented in a more granular manner (e.g., self-pay charges and contractual versus noncontractual adjustments). |
- Available starting from January 2016.
- Current as of the end of the previous day (11:59 p.m. PST)
- Arc gauge chart: Current data. Calculated daily.
- Bar graph: Past data. Presented monthly.
|

- From the reporting tool (Reports > Reports), select Practice Performance for Report Type and Goals for Report Name.
- Click Generate Report.
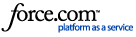
Filters
The generated report is filtered by default by the current month and for the entire practice. Filtering options are by:
- Month and year
- Entire practice, provider, or location
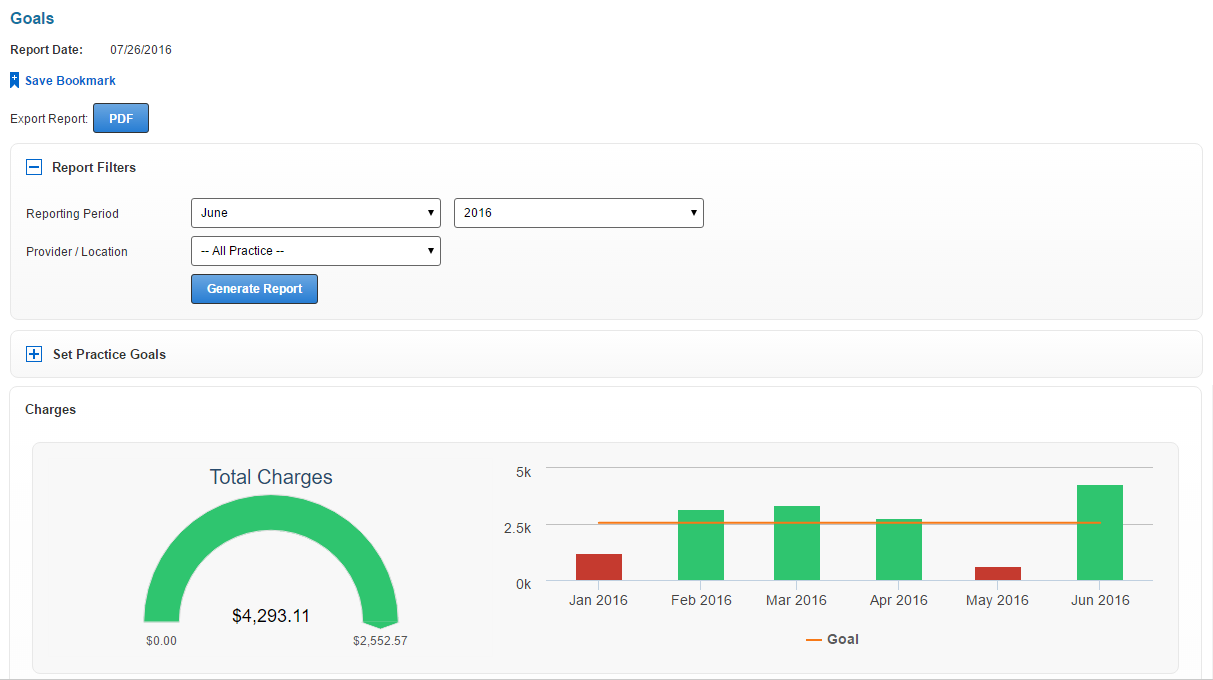
Set Practice Goals
To set practice goals, you must have a financial administrator reporting role in User Maintenance.
- Users with a financial administrator user role will have the Set Practice Goals panel.
- Each data point has its own goal.
- Goals can be edited by practice, provider, or location. Each filtered report has its own goals. For example, goals that you set for an individual provider will not affect the goals that are set for a location or the entire practice.
- If you do not customize the goals, the default goal is the current average.
To expand the panel, click  .
.
You can set all of the goals to a certain percentage of improvement over the current average. The default is 0%.
- Enter a percent value. You can also set each data point's new goal.
- Enter the new goal's value.
- Click Update Goals.
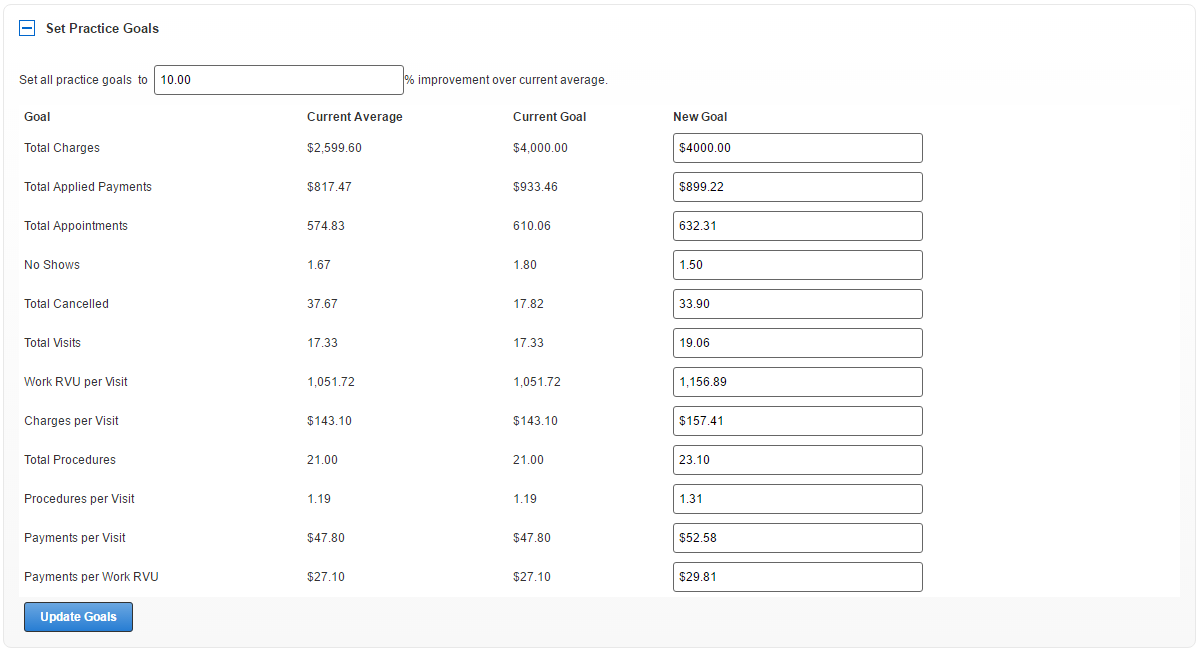
Arc Gauge Chart Colors
The following colors display for current data.
- Green: Over 100% of the goal
- Yellow: 90%-100% of the goal
- Red: Under 90% of the goal
Since the current month's data is calculated daily, the goal depends on which day of the month it is. For example, the goal is $1000 for total applied payments and it is the 15th day of a 30-day month.
- You are 50% done with the month. To meet your goal of $1000, you must have at least $500 today.
- Red: Under 90% of $500.
- Yellow: 90%-100% of $500
- Green: Over 100% of $500
Bar Chart
The orange line indicates the goal.
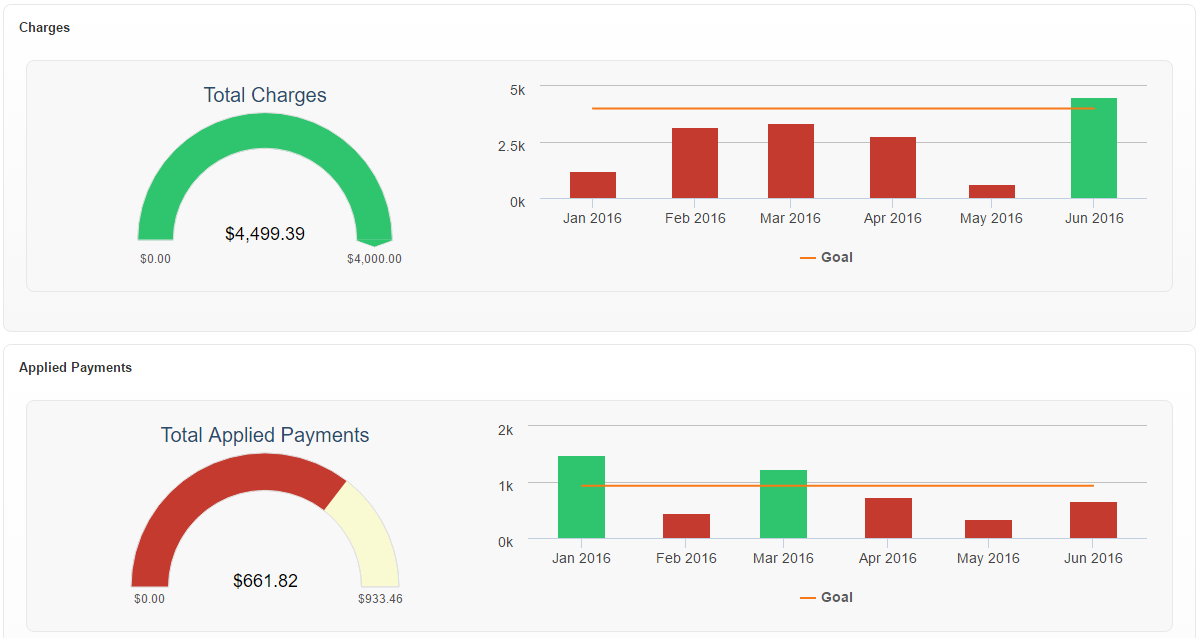
- Being over the goal for data points for charges, payments, and adjustments is desirable.
- Red: The goal is not met.
- Green: The goal is met or surpassed.
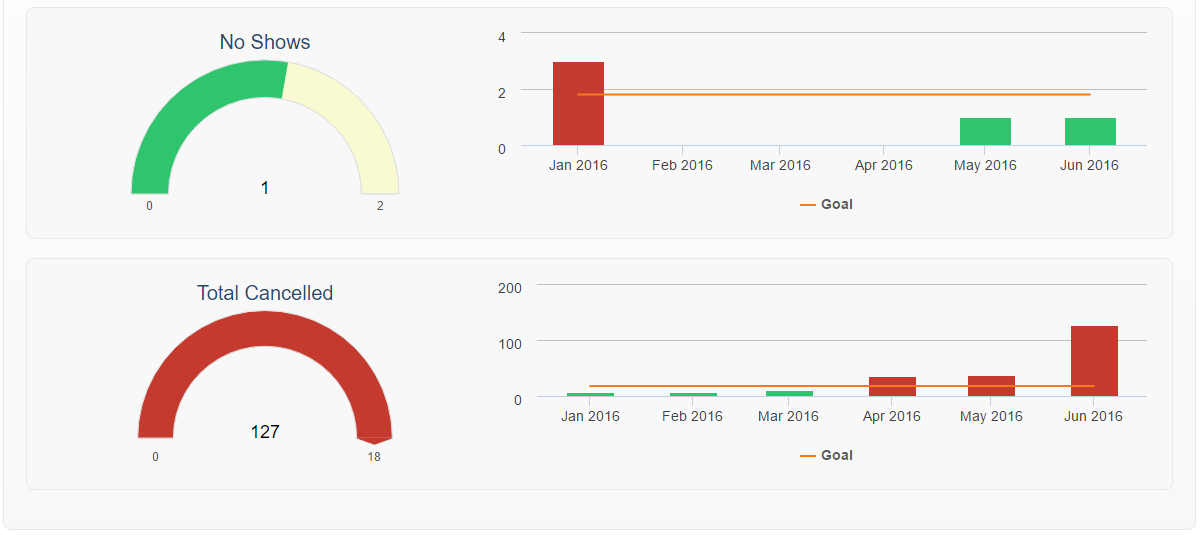
- Being over the goal for data points for appointments is not desirable and, therefore, the colors are reversed in comparison to the financially driven data points.
- Red: Goal is met or surpassed.
- Green: Goal is not met.
Data Points from Provider Month End Report
- Charges
- Payments
- Production
- RVU Production
- Appointments
See Also:
Report Glossary
Reports Index
Reports Reporting Suite
Last Review Date: 06/27/25